Placing Models on Streamlit


What is streamlit?
Streamlit is a web application framework that helps you build and develop Python-based web applications that can be used to share analytics results, build complex interactive experiences, and illustrate new machine learning models. On top of that, developing and deploying Streamlit apps is incredibly fast and flexible, often turning application development time from days into hours.
Why Streamlit?
Streamlit is all about speed and interaction. It has built-in and convenient methods for taking in user input, graphing using the most popular and powerful Python graphing libraries, and quickly deploying graphs to a web application.
Get started
Install Streamlit
Open a new terminal, type in the following command:
Use your new environment
This is how we will run every Streamlit app, by first calling streamlit run and then pointing Streamlit toward the Python script that houses our app’s code.
Display text
Streamlit has unique functions for each type of content (text, graphs, pictures, and other media) that we can use as building blocks for all of our apps. The first one we’ll use is st.write(), which is a function that takes a string and writes it directly into our web app in the order that it is called.
In our app.py file, we can start with the basic ‘Hello World’ output using st.write(), using the following code:
st.write('Hello World')
Other than st.write(), we also can utilize other built-in functions that format our text for us, such as st.title(), st.header(), st.markdown(), and st.subheader(). Using these five functions helps to format text in our Streamlit apps easily and keeps sizing consistent for bigger apps.
More specifically, st.title() will place a large block of text in our app, st.header() uses a slightly smaller font than st.title(), and st.subheader() uses an even smaller one. Other than those three, st.markdown() will allow anyone already familiar with Markdown to use the popular markup language in our Streamlit apps.
Using user input in Streamlit apps
Streamlit has many functions to accept inputs from users, all differentiated by the object that we want to input. There are freeform text inputs with st.text_input(); radio buttons, st.radio(); numeric inputs with st.number_input(); and a dozen more that are extremely helpful for making Streamlit apps.
Suppose we want to simulate 1,000 coin flips and stores those values in a list we call binom_dist. We then sample (with replacement) 100 from that list, take the mean, and store that mean in the cleverly named variable list_of_means. We do that 1,000 times, and then plot the result.
import numpy as np
import matplotlib.pyplot as plt
binom_dist = np.random.binomial(1, .5, 1000)
list_of_means = []
for i in range(0, 1000):
list_of_means.append(np.random.choice(binom_dist, 100, replace=True).mean())
fig, ax = plt.subplots()
ax = plt.hist(list_of_means)
st.pyplot(fig)
In the previous example, we assumed that the coins we were flipping were fair coins and had a 50/50 chance of being heads or tails. What if we want to change that percentage chance of heads? We would have to edit our code and change the second parameter of our binomial function. Now what happens if the user who is using our app doesn’t know how to code or he even does not have access to our source code. We could let the user decide what the percentage chance of heads is, assign that to a variable, and use that as an input in our binomial distribution. The number input function takes a label, a minimum and maximum value, and a default value, which I have filled in the following code:
import numpy as np
import matplotlib.pyplot as plt
pr_heads_input = st.number_input(label='Chance of Coins Landing on Heads', min_value=0.0, max_value=1.0, value=0.5)
binom_dist = np.random.binomial(1, pr_heads_input, 1000)
list_of_means = []
for i in range(0, 1000):
list_of_means.append(np.random.choice(binom_dist, 100, replace=True).mean())
fig, ax = plt.subplots()
ax = plt.hist(list_of_means, range=[0, 1])
st.pyplot(fig)
The preceding code uses the st.number_input() function to collect our percentage, assigns the user input to a variable (pr_heads_input), then uses that variable to change the inputs to our binomial distribution function that we used before.
Every time that we changed the input of our script, Streamlit re-ran the entire application. This is the default behavior and is very important to understanding Streamlit performance.
Uploading and Manipulating Data
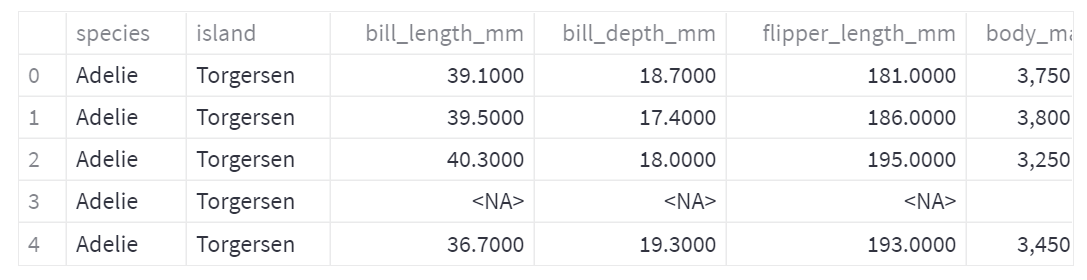
For our first go around, we’re just going to print out the first five rows of our DataFrame using the st.write() function we learned earlier using the following code:
import pandas as pd
import numpy as np
df = pd.read_csv('penguins.csv')
st.write(df.head())
Before we begin working with this dataset, we should make some visualizations to better understand the data.
ax = sns.scatterplot(penguins_df['body_mass_g'], penguins_df['flipper_length_mm'], hue='species', data=penguins_df)
st.pyplot(fig)
As we can see, the Gentoo species has a high flipper length and body mass, and it appears that flipper length is correlated with body mass for all species. Next, let’s look at the relationship between bill length and flipper length:
ax2 = sns.scatterplot(penguins_df['bill_length_mm'], penguins_df['flipper_length_mm'], hue='species', data=penguins_df)
st.pyplot(fig2)
From this graph, we can see that the Chinstrap species seem to have a longer bill than the Adelie species. There are many more combinations of variables that we could plot on a scatterplot, but could we instead make a data explorer Streamlit app do this for us? Absolutely!
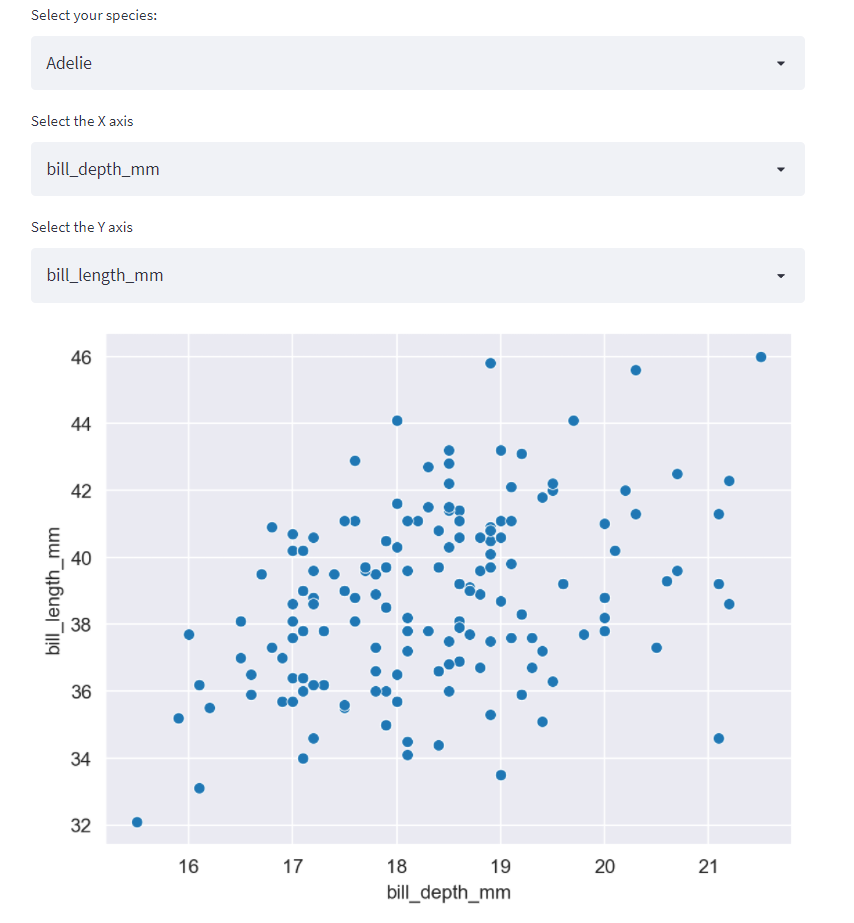
Streamlit has a select box function (st.selectbox()) that allows us to ask the user to select one option from multiple options, and the function returns whatever the user selects. We will use this to get the three inputs for our scatterplot:
selected_x_var = st.selectbox('Select the X axis', ['bill_length_mm', 'bill_depth_mm', 'flipper_length_mm', 'body_mass_g'])
selected_y_var = st.selectbox('Select the Y axis', ['bill_length_mm', 'bill_depth_mm', 'flipper_length_mm', 'body_mass_g'])
This code creates three new variables from three new select boxes that the user can input in our Streamlit app. Now that we have the selected_species variable, we can filter our DataFrame and make a quick scatterplot using the selected x and y variables.
penguins_df = penguins_df[penguins_df['species']==selected_species]
fig, ax = plt.subplots()
ax = sns.scatterplot(penguins_df[selected_x_var], penguins_df[selected_y_var])
plt.xlabel(selected_x_var)
plt.ylabel(selected_y_var)
st.pyplot(fig)
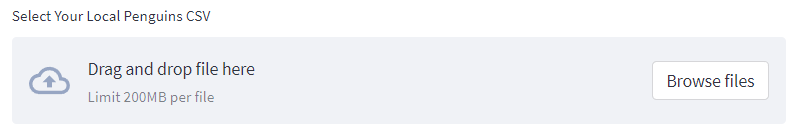
The last step for this app is to allow the user to upload their own data. Streamlit has a function called file_uploader() that allows users of the app to upload data up to 200 MB in size (as a default). It works just like the other interactive widgets we’ve used before, with one exception. Our default in an interactive widget-like select box is just the first value in our list, but it does not make sense to have a default uploaded file before the user actually interacts with the app! The default user uploaded file has a value of None.
This begins to cover a very important concept in Streamlit development, which is flow control. Flow control can be understood as thinking carefully through all the steps of your application because Streamlit will try to run the entire app at once if we’re not explicit about things, such as wanting to wait until the user has uploaded a file to attempt to create a graphic or manipulate a DataFrame.
There are two solutions to this data upload default problem. We can provide a default file to use until the user interacts with the application, or we can stop the app until a file is uploaded. Let’s start with the first option. The following code uses the st.file_uploader() function from within an if statement. If the user uploads a file, then the app uses that; if they do not, then we default to the file we have used before:
if penguin_file is not None:
df = pd.read_csv(penguin_file)
else:
df= pd.read_csv('penguins.csv')
Our second option is to stop the application entirely unless the user has uploaded a file. For that option, we’re going to use a new Streamlit function called stop(), which (predictably) stops the flow whenever it is called.
penguins_df = pd.read_csv(penguin_file)
else:
st.stop()
Using Machine Learning with Streamlit
There are two parts of this process to consider:
- The generation of the ML model
- The use of the ML model in production
If the plan is to train a model once and then use this model in our Streamlit app, the best method is to create this model outside of Streamlit (for example, in a Jupyter notebook or in a standard Python file) first, and then use this model within the app.
If the plan is to use the user input to train the model inside our app, then we can no longer create the model outside of Streamlit and instead will need to run the model training within the Streamlit app.
We will start by building our ML models outside of Streamlit and move on to training our models inside of Streamlit apps after. For this app, we are going to attempt to create an app that will help researchers in the wild know what species of penguin they are looking at. It will predict the species of the penguin given some measurements of the bill, flippers, and body mass, and knowledge about the sex and location of the penguin.
penguin_df = pd.read_csv('penguins.csv')
penguin_df.dropna(how='any', inplace=True)
target = penguin_df['species']
features = penguin_df[['island', 'bill_length_mm', 'bill_depth_mm', 'flipper_length_mm', 'body_mass_g', 'sex']]
features = pd.get_dummies(features)
Now, we want to create a classification model using a subset (in this case, 80%) of our data, and get the accuracy of said model. The following code runs through those steps using a random forest model, but you can use other classification algorithms if you would like.
rfc = RandomForestClassifier(random_state=15) rfc.fit(X_train, y_train)
y_pred = rfc.predict(X_test)
score = accuracy_score(y_pred, y_test)
print(score)
We now have a pretty good model for predicting the species of penguins! Our last step in the model generating process is to save the two parts of this model that we need the most — the model itself and the uniques variable, which maps the factorized output variable to the species name that we recognize. Let’s add a few lines that will save these objects as pickle files.
rf_pickle = open('random_forest_penguin.pickle', 'wb') pickle.dump(rfc, rf_pickle)
rf_pickle.close()
output_picke = open('output_penguin.picke', 'wb') pickle.dump(unique, output_picke)
output_picke.close()
Now that we have our model, we want to load it (along with our mapping function as well) into Streamlit. In our file, penguins_streamlit.py, we will again use the pickle library to load our files using the following code. We use the same functions as before, but instead of wb, we use the rb parameter, which stands for read bytes.
import pickle
rf_pickle = open('random_forest_penguin.pickle', 'rb')
map_pickle = open('output_penguin.pickle', 'rb')
rfc = pickle.load(rf_pickle)
unique_penguin_mapping = pickle.load(map_pickle)
st.write(rfc)
st.write(unique_penguin_mapping)
We now have our random forest classifier, along with the penguin mapping! Our next step is to add Streamlit functions to get the user input. In our app, we used island, bill length, bill depth, flipper length, body mass, and sex to predict the penguin species, so we will need to get each of these from our user. For island and sex, we know which options were in our dataset already and want to avoid having to parse through user text, so we will use selectbox. For the other data, we just need to make sure that the user has input a positive number, so we will use the st.number_input() function and make the minimum value 0.
sex = st.selectbox('Penguin Sex', options=['Female', 'Male'])
bill_length_mm = st.number_input('Bill Length (mm)', min_value=0)
bill_depth_mm = st.number_input('Bill Depth (mm)', min_value=0)
flipper_length = st.number_input('Flipper Length (mm)', min_value=0)
body_mass = st.number_input('Body Mass (mm)', min_value=0)
Now we have all our inputs, and we also have our model. The next step is to format the data into the same format as our preprocessed data, for example, our model does not have one variable called sex but instead has two variables called sex_female and sex_male. Once our data is in the right shape, we can call the predict function and map the prediction to our original species list to see how our model functions.
if island == 'Biscoe':
island_biscoe = 1
elif island == 'Dream':
island_dream = 1
elif island == 'Torgerson':
island_torgerson = 1
sex_female, sex_male = 0, 0
if sex == 'Female':
sex_female = 1
elif sex == 'Male':
sex_male = 1
The last step here is using the predict() function on our model with our new data.
prediction_species = unique_penguin_mapping([new_prediction][0])
We now have a full Streamlit app that utilizes our pre-trained ML model, takes user input, and outputs the prediction.
We can make an improvement on what we have done before. As of now, each time a user changes an input in our app, the entire Streamlit app will rerun. We can use the st.form() and st.submit_form_button() functions to wrap the rest of our user inputs in and allow the user to change all of the inputs and submit the entire form at once instead of multiple times
island = st.selectbox('Penguin Island', options=['Biscoe', 'Dream', 'Torgerson'])
sex = st.selectbox('Sex', options=['Female', 'Male'])
bill_length = st.number_input('Bill Length (mm)', min_value=0)
bill_depth = st.number_input('Bill Depth (mm)', min_value=0)
flipper_length = st.number_input('Flipper Length (mm)', min_value=0)
body_mass = st.number_input('Body Mass (g)', min_value=0)
st.form_submit_button()
We now have a full Streamlit app that utilizes our pre-trained ML model, takes user input, and outputs the prediction.

Made with ❤ from Sigmoid.
Follow us on Facebook, Instagram and LinkedIn:
https://www.facebook.com/sigmoidAI
https://www.instagram.com/sigmo.ai/
https://www.linkedin.com/company/sigmoid/
References
- https://docs.streamlit.io/
- https://learning.oreilly.com/library/view/getting-started-with/9781800565500/